EDF Workbench user guide
From installation to a complete waveform review.
Install EDF Workbench, open recordings, organize channels, navigate and measure waveforms, work with annotations, inspect frequency content, and export review material.
Scope and safety
Before you start
EDF Workbench is a Windows waveform review workspace for technical, research, and educational use. It reads supported recordings, displays signals, and creates separate presentation, annotation, measurement, and export data. It does not modify the source recording.
Supported files
- EDF
- EDF+
- BDF
- BDF+
Support applies within the documented limits of the current release. A malformed, inaccessible, encrypted, or unsupported recording may be rejected with a recovery message. Opening a file does not imply that every optional field or vendor-specific convention is understood.
Protect sensitive data
- Use authorized recordings and follow your organization’s data-handling rules.
- Review exports before sharing them. Metadata and reports exclude identification fields by default, but annotations, channel labels, and visible waveform content may still be sensitive.
- Use synthetic or fully anonymized data when reporting a problem or creating documentation screenshots.
Windows setup
Install and uninstall EDF Workbench
System and package requirements
- 64-bit Windows on an x64 computer.
- Administrator approval during installation.
- The installer is self-contained; a separate .NET installation is not normally required.
- Enough space for the application and for any exports you create. Recordings stay in their original locations.
Install
- Download the current Windows x64 installer from the official download page.
- Compare the installer’s SHA-256 checksum with the value on the release page.
- Run the installer and approve the Windows administrator prompt only after confirming the expected file.
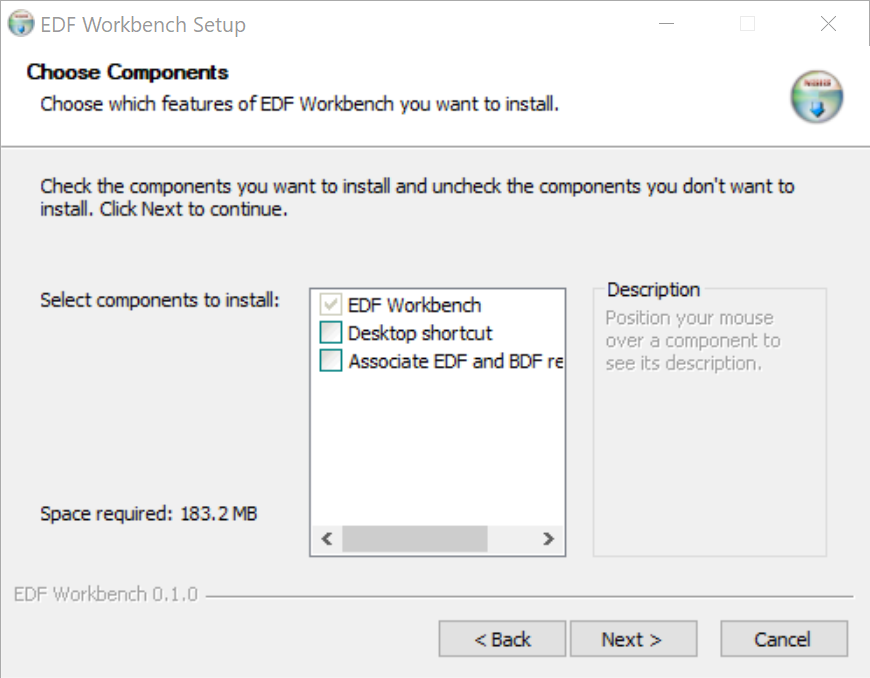
- Review the component choices. The Start menu shortcut is installed. The desktop shortcut and Associate EDF and BDF recordings options are optional and off by default on a clean installation.
- Keep the default location,
C:\Program Files\EDF Workbench, unless you have a specific reason to change it. - Finish setup and start EDF Workbench from the Start menu.
Repair, upgrade, and downgrade
Running the same version repairs or reinstalls the application. A newer version upgrades the existing installation and preserves user settings. Installing an older version over a newer version is blocked before files are changed.
Uninstall
- Open Windows Settings > Apps > Installed apps.
- Find EDF Workbench, open its menu, and choose Uninstall.
- Leave the optional user-data cleanup unchecked if you want to retain preferences and layouts.
The uninstaller never deletes your recordings or exports. Its optional cleanup is limited to recognized EDF Workbench settings, layouts, logs, and caches.
First session
Open one or more recordings
Use the application
- Choose File > Open Recording or press Ctrl+O.
- Select an EDF, EDF+, BDF, or BDF+ file.
- Wait for the recording document to appear. Long annotation scans may show document-specific progress and a safe Cancel action.
- Repeat to open another recording. Each recording appears as an independent document.
File > Open Recent lists up to ten successfully opened recordings. A missing recent file is removed from the list when opening it fails because it no longer exists.
Use Windows Explorer
If you selected file associations during setup, use Open with > EDF Workbench for .edf and .bdf files. Windows remains in control of the default application. Opening another recording while EDF Workbench is running forwards it to the existing workbench.
Use the command line
& "C:\Program Files\EDF Workbench\EDFWorkbench.exe" `
  "C:\Recordings\Night one.edf" `
  "D:\Studies\Night two.bdf"
Quote every path that contains spaces. Files are attempted in order; one invalid file does not prevent later valid files from opening. Opening the same normalized path activates the existing document instead of creating a duplicate.
Workbench tour
Understand and arrange the workspace
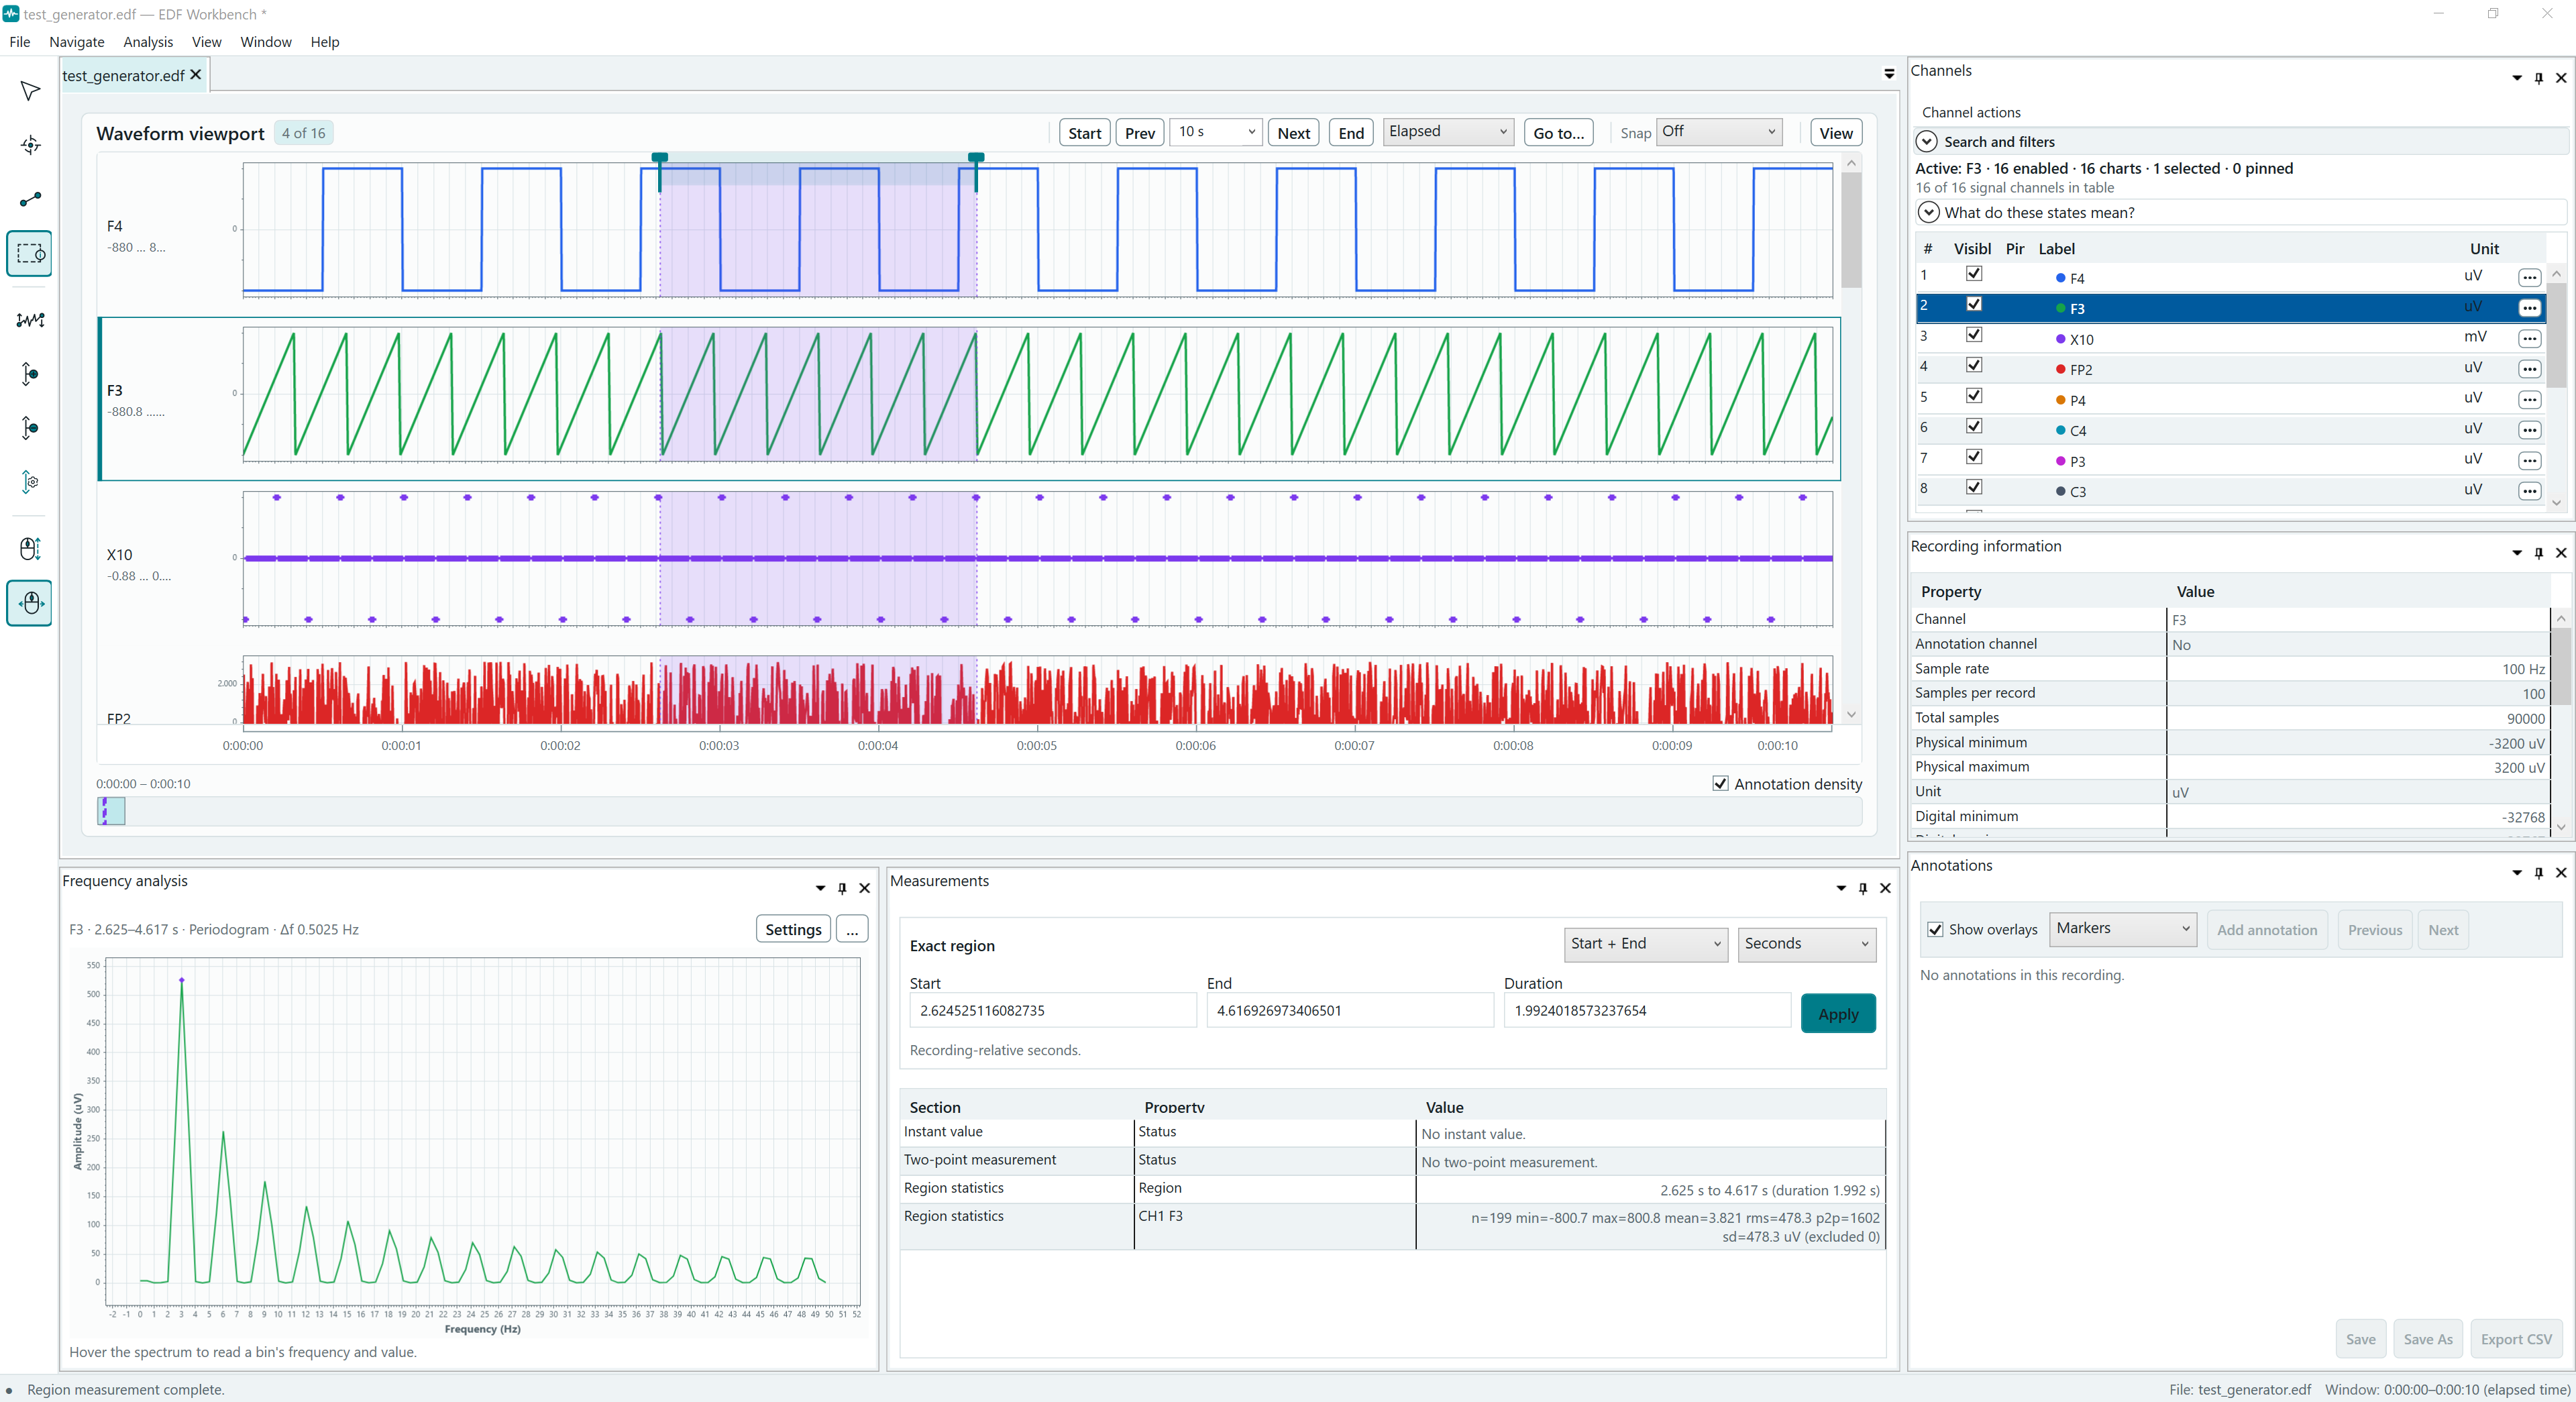
The central document displays the waveform viewport. The left toolbar contains the interaction and amplitude tools used while reviewing a signal. Dockable panes provide Channels, Recording information, Measurements, Annotations, and Frequency analysis.
Use the left toolbar
From top to bottom, the toolbar contains Navigate, Point measurement, Two-point measurement, Region measurement, Fit visible amplitude, Y zoom in, Y zoom out, Amplitude Scale settings, wheel-controlled amplitude zoom, and wheel-controlled time zoom. The four interaction tools and the two wheel modes are mutually exclusive within their respective groups.
- Choose View > Expanded Toolbar if you want text labels beside the icons.
- Hover an icon for its name and shortcut. Keyboard users can tab to a tool and press Space or Enter.
- Amplitude commands require an active chart. Click a chart first when a command is unavailable.
Read the waveform header
The header keeps the recording controls in one compact row. Beside Waveform viewport, a badge reports the charts currently in the viewport relative to the available presentations. Navigation is ordered as Start, Previous window, window duration, Next window, End, and time-display mode.
- Choose Go to…, or press Ctrl+G, to reveal exact-time navigation. The editor closes again after a successful jump.
- Choose View in the waveform header for row density, automatic channel-label sizing, source channel numbers, rendering provenance, and the selected chart’s Y-scale status.
- Region snapping appears in the header only while the Region measurement tool is active.
- At compact window widths, navigation labels become shorter while their tooltips and accessible names remain available.
Show, hide, dock, or float panes
- Use the View menu to show or hide each pane.
- Drag a pane title to reposition, dock, or float it. Use the pane pin to switch between docked and auto-hidden behavior.
- Choose View > Reset Workspace if a pane is lost or the layout becomes impractical.
- Press F11 for Waveform Focus Mode. Press it again to restore the previous pane arrangement.
- Use View > Theme to switch between light and dark themes.
The docking layout and theme are saved separately. Reset Workspace changes pane geometry; it does not close recordings or erase measurement, annotation, or channel presentation state.
Close the application and save project changes
Opening and viewing a recording does not create an unsaved project change. Initial rendering, maximizing or resizing the application, changing theme, and other redraw-only actions also remain clean. You can close EDF Workbench after these actions without being asked to save a project.
After a project-persisted change, the window title shows an asterisk and closing EDF Workbench offers Save, Don’t save, and Cancel. Save writes the project before closing; Don’t save closes without writing the project; Cancel returns to the complete open workspace. Unsaved user annotations may require their own recording-specific decision.
Work with multiple recordings
Choose a document tab, select a recording from the Window menu, or use Ctrl+Tab and Ctrl+Shift+Tab. The Channels, Recording information, Measurements, Annotations, and Frequency analysis surfaces follow the active recording without transferring state from another document.
Channel presentations
Choose, arrange, and style channels
The Channels pane separates source signals from their visual presentations. Checking visibility changes what is displayed immediately; selecting a row identifies the active presentation.
Find and show channels
- Open the collapsible search/filter area to search labels or filter visible/pinned state.
- Use Channel actions or the row context menu to show only one channel, show/hide selected rows, show/hide all, invert visibility, pin, or reorder presentations.
- Press Space on a focused row to toggle visibility. Use Left/Right to collapse or expand groups.
Duplicate or merge presentations
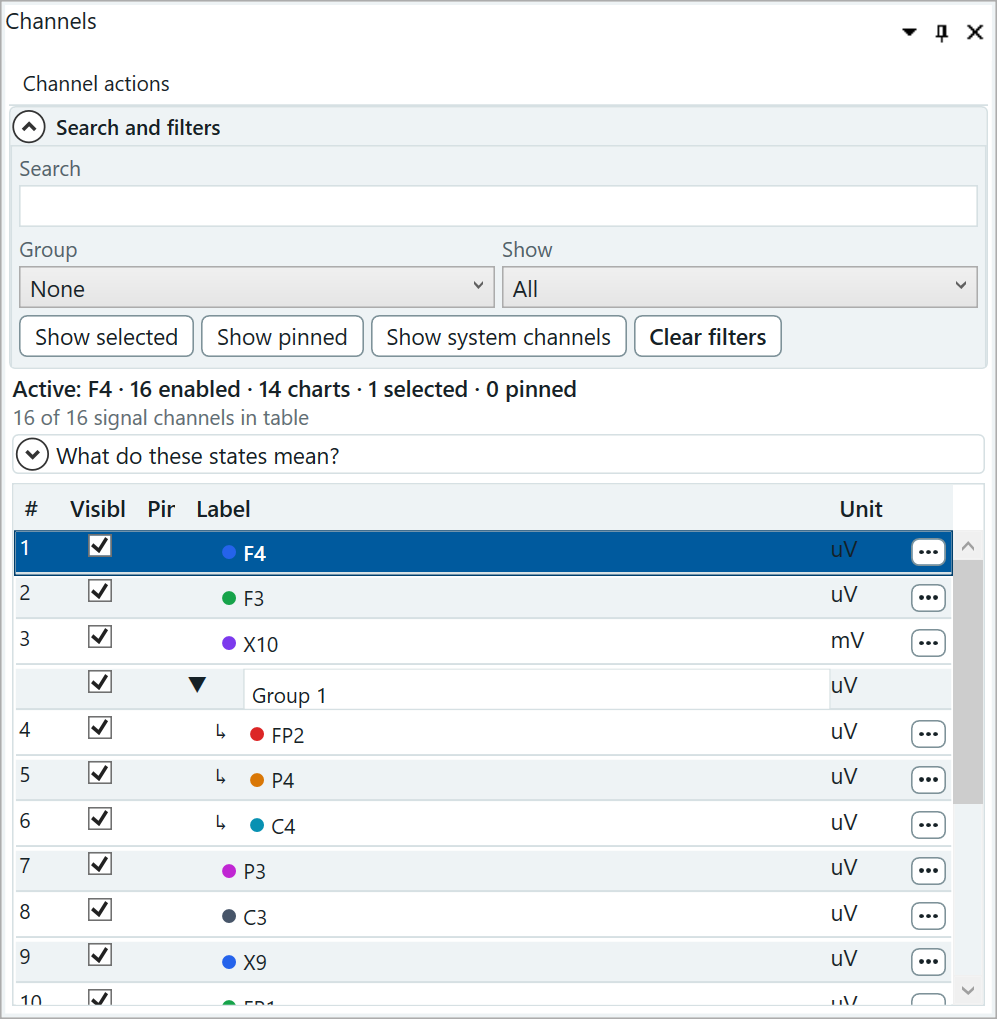
Duplicate channel presentation creates another visual presentation of the same source signal. It may use different color, style, order, and amplitude settings without duplicating recording samples.
Select two or more compatible channels and choose Merge into one chart to create a composite group. Group members appear indented in the tree and share one chart and one compatible unit scale. Unmerge the group or remove a member through Channel actions. Frequency analysis uses the active member of a composite.
Change a trace appearance
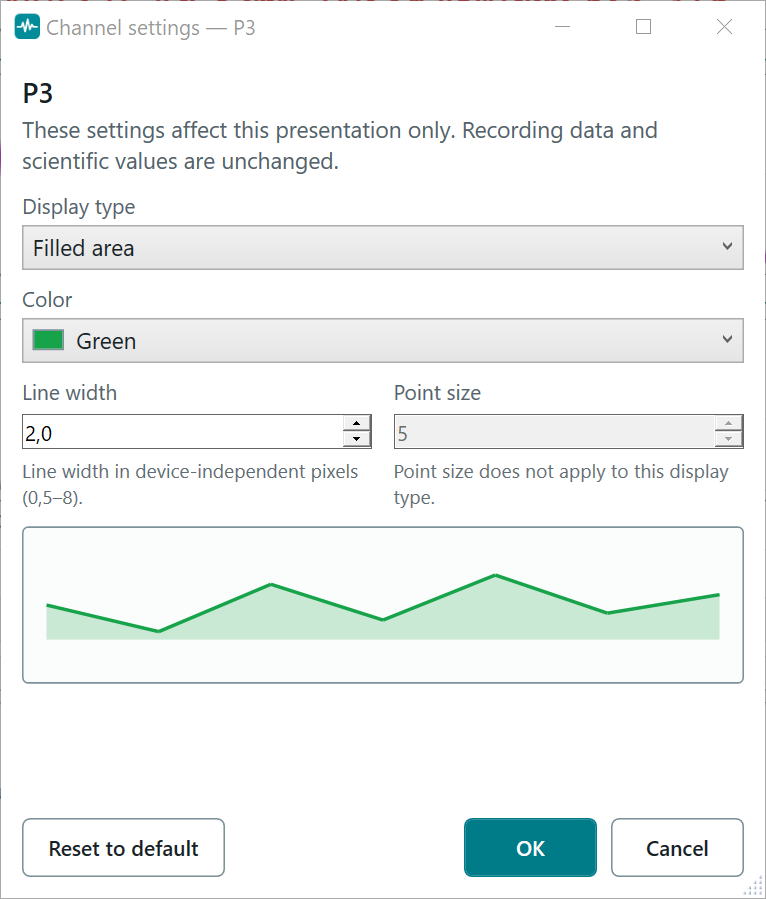
Choose the … button for a presentation. Available display types are Line, Step, Circle points, Cross points, Line with circle points, Line with cross points, Impulse/stem, and Filled area. Choose a preset or custom RGB color and set the applicable line width or point size. Spectrogram is shown as planned and cannot be selected.
Vertical scale
Adjust amplitude without changing samples
Amplitude controls change the Y-axis of a chart. They never change its values or the visible time window.
- Fit selected chart: fits the selected chart to finite samples in the visible time window. Shortcut: Ctrl+Alt+0.
- Zoom in/out amplitude: changes sensitivity for the selected chart. Shortcuts: Ctrl+Alt++ / -.
- Fit all visible charts: fits all visible charts once. Shortcut: Ctrl+Alt+F.
- Wheel mode: choose whether the wheel controls amplitude or time. When amplitude is selected, Ctrl+wheel still controls time.
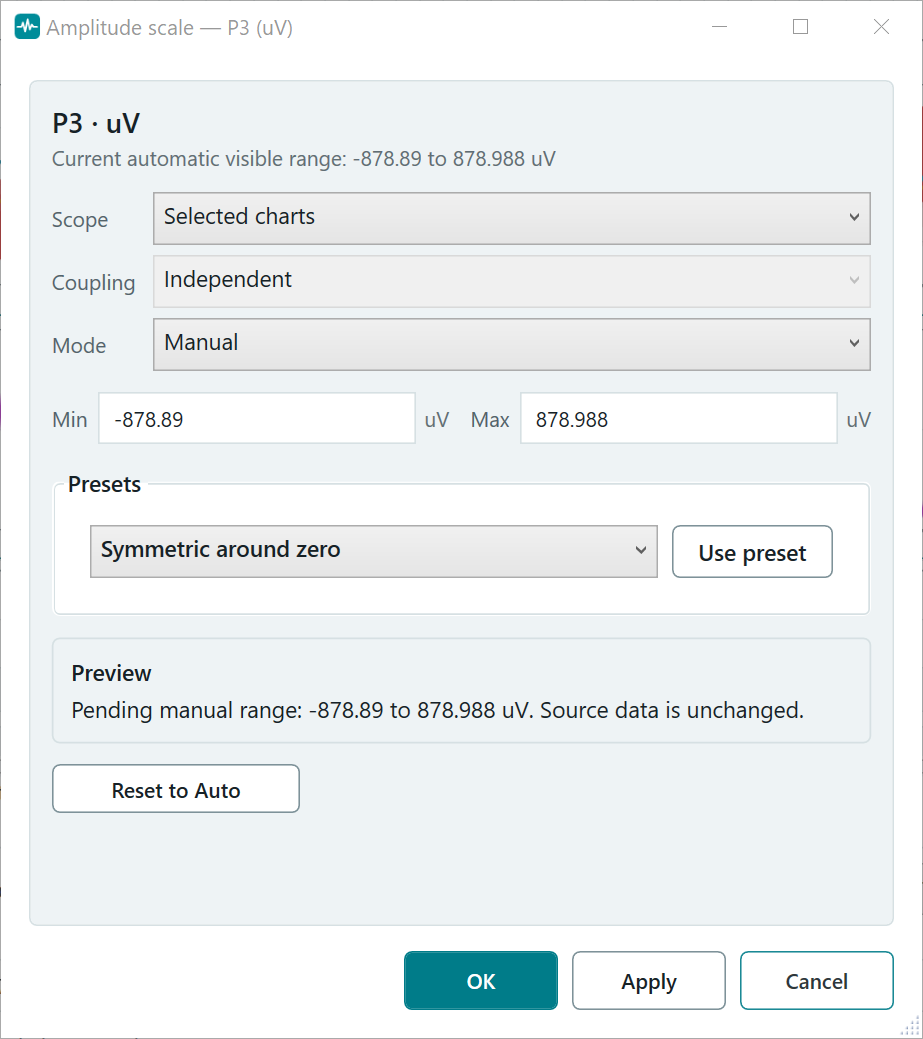
- Amplitude Scale Settings: opens the modal editor. Shortcut: Ctrl+Alt+A.
In the modal editor, choose the target scope, switch between Auto and Manual, enter valid minimum and maximum values, preview the result, then apply. Cancel restores the pre-dialog state. For a composite group, the validated range applies to the shared compatible scale.
Quantitative review
Take point, delta, and region measurements
Point measurement
- Press Ctrl+2.
- Click a chart at the time of interest.
- Read the selected channel, time, and physical value in Measurements.
Two-point measurement
- Press Ctrl+3.
- Place two points on the same channel.
- Review time difference, amplitude difference, and any available reciprocal-frequency value.
Region measurement
- Press Ctrl+4.
- Drag across the desired time range. Press Esc to cancel the in-progress selection.
- Review the resolved region and statistics for applicable visible source channels.
The exact region editor accepts recording-relative times and lets you refine Start, End, and Duration. Apply only a valid range inside the recording. Selected-region actions can zoom to the region, add an annotation, export source samples as CSV, or clear the region.
Results are presented in a three-column Section, Property, and Value grid. Rows grow when a long value needs more than one line, and full-precision detail remains available through the value tooltip. Use the grid context menu to copy a summary or table. Export immutable measurement results from File > Export > Export Measurement Results as CSV.
Events and notes
Review recording annotations and save user annotations
Recording annotations come from supported EDF+/BDF+ content and are read-only. User annotations are separate, editable notes stored in an EDF Workbench sidecar; the source recording is not modified.
Browse recording annotations
- Use Previous/Next, double-click an annotation, or choose Go to from its context menu.
- Open the search/filter panel to search text, choose event type, limit results to the visible window or a specific time range, change sort order, or summarize repeated events.
- Use the overlay controls to show/hide markers and adjust label density.
Create and edit user annotations
- Choose Add annotation, or select a measurement region and use Analysis > Selected region > Add annotation.
- Enter the recording-relative onset, optional duration, and text.
- Save the user annotations. Use Edit or Delete only on a user annotation.
The default sidecar is named after the recording with the suffix .edfworkbench.annotations.json. Keep it with the intended recording. If Save reports a fingerprint or association mismatch, do not force it onto another recording; use Save As or reopen the correct pair.
Export CSV can export all, filtered, or selected annotations and identifies recording versus user provenance.
Selected-region analysis
Inspect frequency content
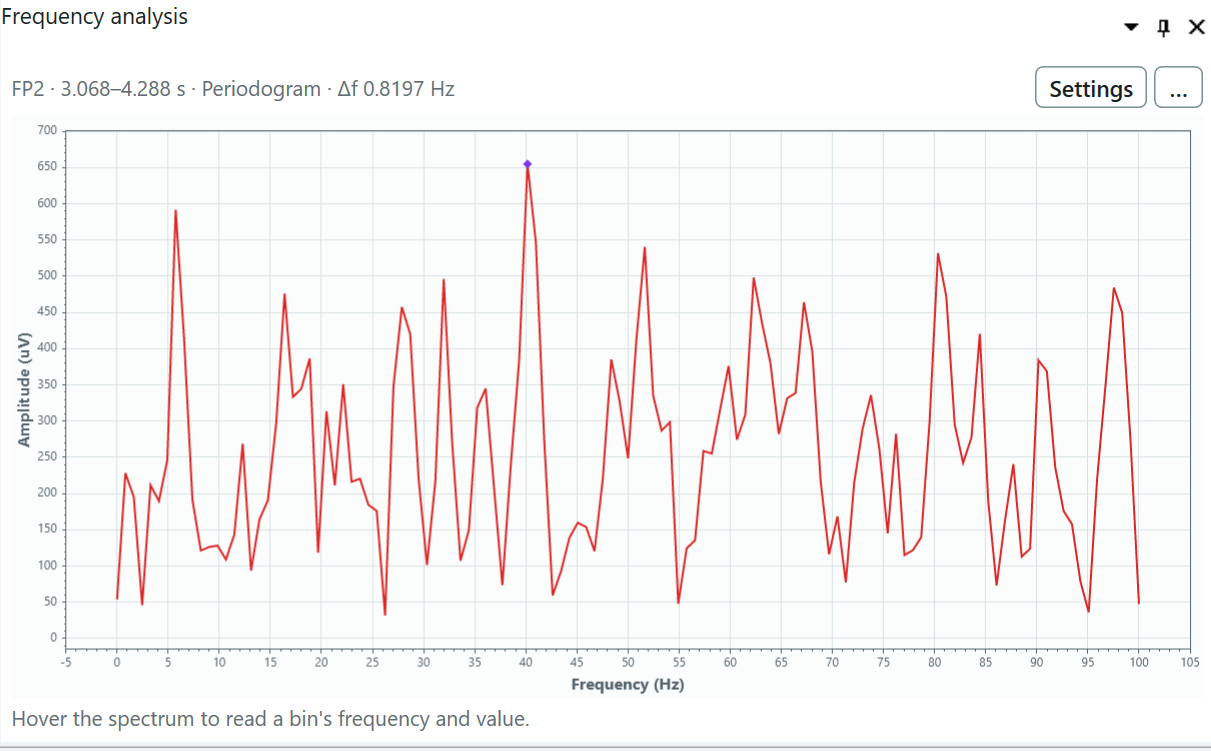
Frequency analysis applies to a completed measurement region and an applicable ordinary source channel. In a composite group, select the member you intend to analyze. Completing or changing the region, or selecting another applicable chart, refreshes the active document’s analysis automatically.
- Show the Frequency analysis pane from Analysis > Frequency analysis or the View menu.
- Create a valid region with the Region tool and select the intended channel or composite member.
- Inspect the spectrum. The compact header identifies the channel, region, method, and resolution without taking space from the chart.
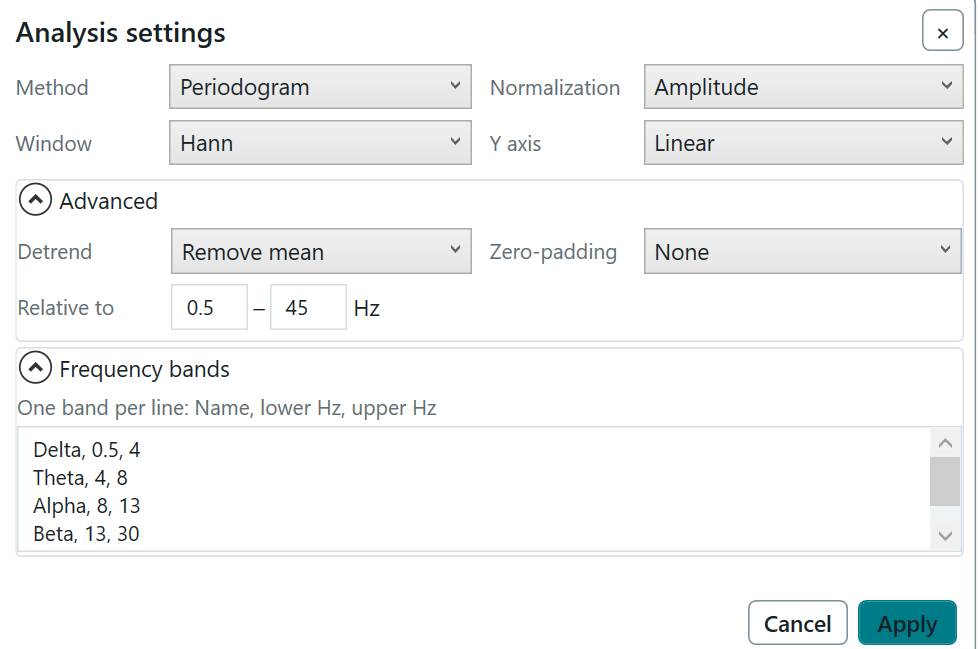
- Choose Settings to open the overlay drawer. Basic controls use a compact two-column layout when space permits; Detrend, zero padding, Welch parameters, relative-power denominator, and named bands are under Advanced or Frequency bands.
- Choose Apply to commit changed settings and recompute. Choose Cancel or close the drawer to keep the previous configuration.
Settings are drafts until Apply, so changing several controls does not trigger repeated expensive calculations. The drawer overlays the chart instead of permanently reducing its height. Use the … actions menu to show analysis details, copy the summary or spectrum table, or export spectrum and band-power CSV. Exported values include method and normalization context. Frequency analysis does not provide automated diagnostic interpretation.
Interoperability
Export data, images, annotations, and reports
| Output | Contains | Important note |
|---|---|---|
| Waveform CSV | Visible source channels and the visible or selected half-open time window. | Long-form rows preserve each native sample rate; no shared grid is invented. |
| Metadata CSV | Technical recording and channel fields. | Patient and recording identification are excluded unless explicitly included. |
| Annotation CSV | All, filtered, or selected recording/user annotations. | Review text and provenance before sharing. |
| Measurement CSV | Resolved point, two-point, and region result rows. | Unavailable values remain explicit. |
| PNG or JPEG | The visible waveform viewport in the active theme and selected resolution. | Use PNG for small text and line detail; JPEG is lossy. |
| Spectrum/band CSV | Frequency bins or named-band outputs plus method context. | Requires a completed frequency analysis. |
| HTML report | Explicitly selected metadata, viewport image, annotations, and measurements. | Self-contained and offline; not a certified clinical report. |
Safe export workflow
- Activate the correct recording and set the intended visible channels and time range.
- Choose the required command under File > Export, or use the relevant pane’s export command.
- Review scope, privacy options, image format/resolution, or report sections.
- Select the destination. For long work, use the document-specific Cancel action if needed; Retry becomes available after a cancellable or recoverable failure.
- Open and inspect the finished file before sharing it.
Export uses a temporary sibling file and publishes only complete output. Cancellation or failure does not leave a partial destination. The visible status uses only a safe file name, not a full path or recording content.
Personalize the display
Preferences and accessibility
Open Analysis > Preferences or press Ctrl+,. Display preferences apply globally to open documents and can include label width/auto-fit, source channel number, channel density, default time window and format, numeric significant figures, signal palette, mouse-wheel behavior, expanded toolbar, and non-color line-pattern differentiation.
- Use light or dark theme from View. Windows High Contrast uses system-aware resources where available.
- Enable line-pattern differentiation when color alone is insufficient.
- Use the expanded toolbar when labels help identify actions.
- Use F6 to move through major workbench regions and Esc to leave transient interaction or restore a safe focus location.
- Use Shift+F10 for context actions on a focused chart or grid row.
Numeric significant figures affect presentation, not stored or exported source precision. Channel color and line settings are also presentation-only.
Release lifecycle
Check for updates
During the public preview, EDF Workbench may occasionally display a reminder to check for updates. Choose Continue to close it, or Check for updates to run the same user-initiated check available from the Help menu. After the preview period, this occasional reminder is replaced by the obsolete-preview notice shown on every launch.
Choose Help > Check for Updates. EDF Workbench anonymously reads the signed Stable feed from https://edfworkbench.com/updates/stable/appcast.xml. If a newer qualified release is available, you can review it and choose whether to download and install it. The application does not send recording data, workspace data, a machine identifier or credentials during an update check.
If the feed is unavailable or fails its signature, product, version, sequence, architecture or publisher checks, the current installation remains usable and no update is installed. You can retry later or use the official Download page.
Automatically Check for Updates is optional and off by default. Update checks never send recording paths, samples, patient metadata, annotations, channel labels, or workspace content. Normal web hosting may still log your IP address and requested URL.
Local data
Know what EDF Workbench stores
| Location | Typical content |
|---|---|
%APPDATA%\EDFWorkbench |
Theme, dock layout, recent-file list, persisted channel presentation/session layout, and update preferences/high-water state. |
%LOCALAPPDATA%\EDFWorkbench |
Waveform display preferences and the bounded update staging/cache area. |
| Beside or at a user-selected location | User annotation sidecars and every export you choose to save. |
| Original recording location | Your EDF/BDF file. EDF Workbench reads it and does not overwrite it. |
The recent-files list necessarily contains local recording paths. The persisted channel layout uses hashed recording/channel lookup keys rather than headers or samples. Do not edit JSON files while EDF Workbench is running. Back up settings only if you need to reproduce a layout; never assume they replace the original recording or annotation sidecar.
Before requesting support
- Do not send a patient recording unless an explicit authorized support process requires it.
- Remove identifiers and private paths from screenshots and logs.
- Include application version, Windows version, steps to reproduce, expected/actual result, theme/scaling, and whether the issue occurs with synthetic data.
Recovery
Troubleshooting
Windows blocks or warns about the installer
Qualified preview installers are Authenticode-signed by Krop System SRL and timestamped. Confirm that you downloaded the installer from the official HTTPS site, that Windows shows that publisher, and that its SHA-256 matches the release page. If any check fails, delete the file. EDF Workbench documentation does not recommend disabling Windows security controls.
The installed application reports Access is denied
This can indicate incorrect file permissions from an older installer. Uninstall the affected build, install the current qualified package as an administrator, and retry. The executable should be readable and executable by normal users even though installation requires elevation.
A recording will not open
- Confirm the path exists and your account can read it.
- Confirm the extension is EDF/EDF+/BDF/BDF+ and the file is not truncated or locked by another process.
- Use the application’s concise message and optional technical category; do not publish the full private path.
- Try a known synthetic recording to distinguish an application problem from a file-specific problem.
A pane is missing or the layout is unusable
Use the View menu to show the pane. If that is not enough, choose View > Reset Workspace. This resets docking geometry without deleting recordings or source data.
A waveform looks incomplete or stale
Confirm channel visibility, active presentation, time window, amplitude range, and rendering provenance. Use Fit Selected Chart or Fit All Visible Charts. If the display still disagrees with exported source values, record a synthetic reproducible case and contact support.
An annotation sidecar does not load or save
Confirm it belongs to the same recording and has not been modified externally. Use Save As rather than overwriting a mismatched sidecar. Keep both the recording and sidecar backed up.
An export fails
Choose a writable destination with enough free space, close any application that has locked the destination, then use Retry. Cancellation and failure preserve an existing destination and remove temporary output.
Reference
Keyboard shortcuts
| Shortcut | Action |
|---|---|
| Ctrl+O | Open recording |
| Ctrl+W | Close active recording |
| Ctrl+Tab | Next recording |
| Ctrl+Shift+Tab | Previous recording |
| Ctrl+= / Ctrl+- | Zoom time in / out |
| Left / Right | Pan time left / right |
| Home / End | Go to recording start / end |
| Ctrl+G | Focus exact-time field |
| Ctrl+1 … 4 | Navigate / Point / Two-point / Region tool |
| Ctrl+Alt+0 | Fit selected chart amplitude |
| Ctrl+Alt++ / - | Zoom selected chart amplitude in / out |
| Ctrl+Alt+F | Fit all visible chart amplitudes |
| Ctrl+Alt+A | Amplitude Scale settings |
| Ctrl+, | Display preferences |
| F11 | Toggle Waveform Focus Mode |
| F6 | Move through major workbench regions |
| Shift+F10 | Open context menu for the focused item |
| Esc | Cancel an in-progress region/transient action or restore safe focus |